A quick look on WLSDM for WebLogic Server
Posted by Dirk Nachbar on Wednesday, June 22, 2016
WLSDM (WL Smart Dashboard & Monitoring) was already mentioned by some people within the Oracle WebLogic Community.
The WLSDM tool is a Console extension with which you can monitor your Oracle WebLogic Server environment. But its not only a pure monitoring tool, its more than this, it provides on top even Notifications and Alarms for metrics.
Current release for WLSDM is 2.3.1 which also comes with Oracle SOA Support :-)
The installation is really straight forward as described in the installation document from the WLSDM, but the given 1 minute deploy time is a bit optimistic :-) its more 5 minutes, but this is still impressive how quick you can setup WLSDM :-) Just follow the instructions for the installation, after you start the WLSDM Dashboard, the configuration assistant will guide you through the necessary configuration and your Monitoring and Notification/Alarm System is ready to use.
WLSDM comes is real Dashboard Style with provides you several views on your WebLogic Server environment.
General Health Overview Dashboard:

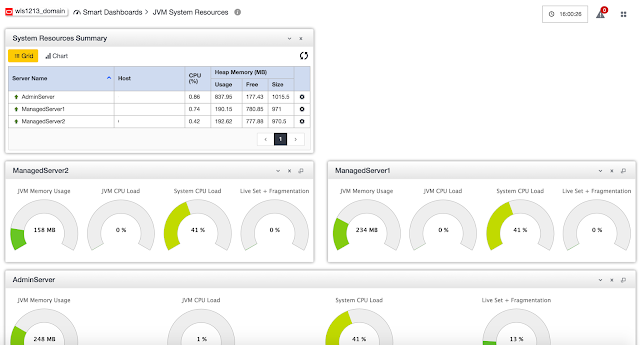
JVM Resources Dashboard:
You want to know what SQL Statements are executed from your deployed applications and what was the execution time? Have a look under the section Monitoring & Diagnostics - Back-end Systems.
Either as Chart View:

Or in a list view:

And you can see even more details by clicking the lense symbol:

Under the Section Operational Tools & Utils you can find various helpful stuff like Log File Viewer, Thread Dump Analyzer, MBean Search, Decrypt -Encrypt and so on. My personal favourite is the WLST Web Console, here you can execute directly from your web browser WLST commands or execute WLST Python Scripts.

WLSDM is really a cool Monitoring Dashboard, which is worth to have a look ... :-)
The WLSDM tool is a Console extension with which you can monitor your Oracle WebLogic Server environment. But its not only a pure monitoring tool, its more than this, it provides on top even Notifications and Alarms for metrics.
Current release for WLSDM is 2.3.1 which also comes with Oracle SOA Support :-)
The installation is really straight forward as described in the installation document from the WLSDM, but the given 1 minute deploy time is a bit optimistic :-) its more 5 minutes, but this is still impressive how quick you can setup WLSDM :-) Just follow the instructions for the installation, after you start the WLSDM Dashboard, the configuration assistant will guide you through the necessary configuration and your Monitoring and Notification/Alarm System is ready to use.
WLSDM comes is real Dashboard Style with provides you several views on your WebLogic Server environment.
General Health Overview Dashboard:

JVM Resources Dashboard:

You want to know what SQL Statements are executed from your deployed applications and what was the execution time? Have a look under the section Monitoring & Diagnostics - Back-end Systems.
Either as Chart View:

Or in a list view:

And you can see even more details by clicking the lense symbol:

Under the Section Operational Tools & Utils you can find various helpful stuff like Log File Viewer, Thread Dump Analyzer, MBean Search, Decrypt -Encrypt and so on. My personal favourite is the WLST Web Console, here you can execute directly from your web browser WLST commands or execute WLST Python Scripts.

WLSDM is really a cool Monitoring Dashboard, which is worth to have a look ... :-)
Categories: Oracle WebLogic Server 12c, WLSDM


